

2 Days
7 Days
15 Days
Zoom
Stack Plot
Data explorer
Most recent data for this station is more than one week old, for more details:
- Check network
status for current issues
- Check the INVENTORY for historical data
Time on PST
MM DD h:m
Not working
>48h
<48h
<24h
RAW
PRELIMINARY
VERIFIED
Station: SATURN-01
| Year | MSL Depth |
Variable (ID Name) | N Recorded | N After QA | N Possible Records |
% Possible | % After QA |
|---|---|---|---|---|---|---|---|
| 2007 | .00 | salt | 2067514 | N/A | 17578885 | 11.8 | N/A |
| 2007 | .00 | temp | 2067514 | N/A | 17578885 | 11.8 | N/A |
| 2008 | .00 | fluores | 14512933 | N/A | 22723199 | 63.9 | N/A |
| 2008 | .00 | isus_inter | 1201391 | N/A | N/A | N/A | |
| 2008 | .00 | isus_slope | 1201391 | N/A | N/A | N/A | |
| 2008 | .00 | pres | 7908906 | N/A | N/A | N/A | |
| 2008 | .00 | salt | 18523909 | N/A | 42330 | N/A | N/A |
| 2008 | .00 | temp | 18523887 | N/A | 42330 | N/A | N/A |
| 2008 | .00 | turbidity | 14512933 | N/A | 22723199 | 63.9 | N/A |
| 2008 | 7.40 | cond | 174556 | N/A | N/A | N/A | |
| 2008 | 7.40 | salt | 15292501 | N/A | 8400000 | N/A | N/A |
| 2008 | 7.40 | temp | 15285807 | N/A | 8400000 | N/A | N/A |
| 2009 | .00 | cdom | 6773630 | N/A | 9776047 | 69.3 | N/A |
| 2009 | .00 | fluores | 15910039 | N/A | 31536000 | 50.5 | N/A |
| 2009 | .00 | isus_inter | 14517 | N/A | N/A | N/A | |
| 2009 | .00 | isus_slope | 14517 | N/A | N/A | N/A | |
| 2009 | .00 | pres | 29875797 | N/A | N/A | N/A | |
| 2009 | .00 | salt | 14583687 | N/A | 525600 | N/A | N/A |
| 2009 | .00 | temp | 14583687 | N/A | 525600 | N/A | N/A |
| 2009 | .00 | turbidity | 15910039 | N/A | 31536000 | 50.5 | N/A |
| 2010 | .00 | cdom | 4690209 | N/A | 5843554 | 80.3 | N/A |
| 2010 | .00 | clay | 658677 | N/A | N/A | N/A | |
| 2010 | .00 | fluores | 3011095 | N/A | 5855241 | 51.4 | N/A |
| 2010 | .00 | isus_inter | 35450 | N/A | N/A | N/A | |
| 2010 | .00 | isus_slope | 35450 | N/A | N/A | N/A | |
| 2010 | .00 | oxygen | 681298 | N/A | N/A | N/A | |
| 2010 | .00 | oxygensat | 681298 | N/A | N/A | N/A | |
| 2010 | .00 | phycoeryth | 4957316 | N/A | N/A | N/A | |
| 2010 | .00 | pres | 27486647 | N/A | N/A | N/A | |
| 2010 | .00 | salt | 2732322 | N/A | 97587 | N/A | N/A |
| 2010 | .00 | sand | 658677 | N/A | N/A | N/A | |
| 2010 | .00 | silt | 658677 | N/A | N/A | N/A | |
| 2010 | .00 | sum | 658677 | N/A | N/A | N/A | |
| 2010 | .00 | sumscat | 658677 | N/A | N/A | N/A | |
| 2010 | .00 | tau | 658677 | N/A | N/A | N/A | |
| 2010 | .00 | temp | 2732322 | N/A | 97587 | N/A | N/A |
| 2010 | .00 | turbidity | 3011095 | N/A | 5855241 | 51.4 | N/A |
| 2010 | 2.40 | oxygen | 8175 | N/A | N/A | N/A | |
| 2010 | 8.20 | oxygen | 8417 | N/A | N/A | N/A | |
| 2010 | 13.00 | oxygen | 8564 | N/A | N/A | N/A | |
| 2010 | 18.00 | oxygen | 5376 | N/A | N/A | N/A | |
| 2011 | .00 | oxygen | 1704795 | N/A | N/A | N/A | |
| 2011 | .00 | oxygensat | 1704795 | N/A | N/A | N/A | |
| 2011 | .00 | phycoeryth | 10297461 | N/A | N/A | N/A | |
| 2011 | .00 | pres | 20583115 | N/A | N/A | N/A | |
| 2011 | 2.40 | oxygen | 31154 | N/A | N/A | N/A | |
| 2011 | 8.20 | oxygen | 30544 | N/A | N/A | N/A | |
| 2011 | 13.00 | oxygen | 30410 | N/A | N/A | N/A | |
| 2011 | 18.00 | oxygen | 25071 | N/A | N/A | N/A | |
| 2011 | 19.50 | cond | 45460 | N/A | N/A | N/A | |
| 2012 | .00 | clay | 334038 | N/A | N/A | N/A | |
| 2012 | .00 | oxygen | 1793109 | N/A | N/A | N/A | |
| 2012 | .00 | oxygensat | 1793108 | N/A | N/A | N/A | |
| 2012 | .00 | phycoeryth | 8925711 | N/A | N/A | N/A | |
| 2012 | .00 | pres | 17871936 | N/A | N/A | N/A | |
| 2012 | .00 | sand | 334038 | N/A | N/A | N/A | |
| 2012 | .00 | silt | 334038 | N/A | N/A | N/A | |
| 2012 | .00 | sum | 334038 | N/A | N/A | N/A | |
| 2012 | .00 | sumscat | 334038 | N/A | N/A | N/A | |
| 2012 | .00 | tau | 334038 | N/A | N/A | N/A | |
| 2012 | 2.40 | oxygen | 29794 | N/A | N/A | N/A | |
| 2012 | 8.20 | oxygen | 30163 | N/A | N/A | N/A | |
| 2012 | 13.00 | oxygen | 29892 | N/A | N/A | N/A | |
| 2012 | 18.00 | oxygen | 29088 | N/A | N/A | N/A | |
| 2012 | 19.50 | cond | 110136 | N/A | N/A | N/A | |
The preceding table was generated by computing the number of possible samples per year across all instrument deployments at a given station and depth.
- MSL depth is the NGVD29 depth of the instrument deployments in meters. Several stations have had multiple simultaneous deployments at varying depths, e.g. red26 and am169.
- The 'N Recorded' column gives the number of data records retrieved from the deployment(s) and includes data received from telemetry and data downloaded from the instruments internal recorder. Not all instruments have internal recorders so records received are from telemetry only.
- The 'N After QA' column is the number of records for each physical variable that survived quality control procedures. Salinity is most sensitive to biofouling and is the variable most likely to fail quality control tests.
- The 'N Possible Records' is the number of records that could be seen given the length of cumulative deployments and the sample rate for each deployment.
- The '% Possible' column is the percentage of actual records retrieved. The 'N/A' indicates possible problems in the database such as an incorrect sampling rate or computational issues with this application that need further investigation.
- The '% After QA' column is the percentage of records surviving quality control procedures. The 'N/A' indicates possible problems in the database such as an incorrect sampling rate or computational issues with this application that need further investigation.
See the page
QA/QC Information and Procedures
for general information regarding quality controlled data levels and QA/QC procedures.
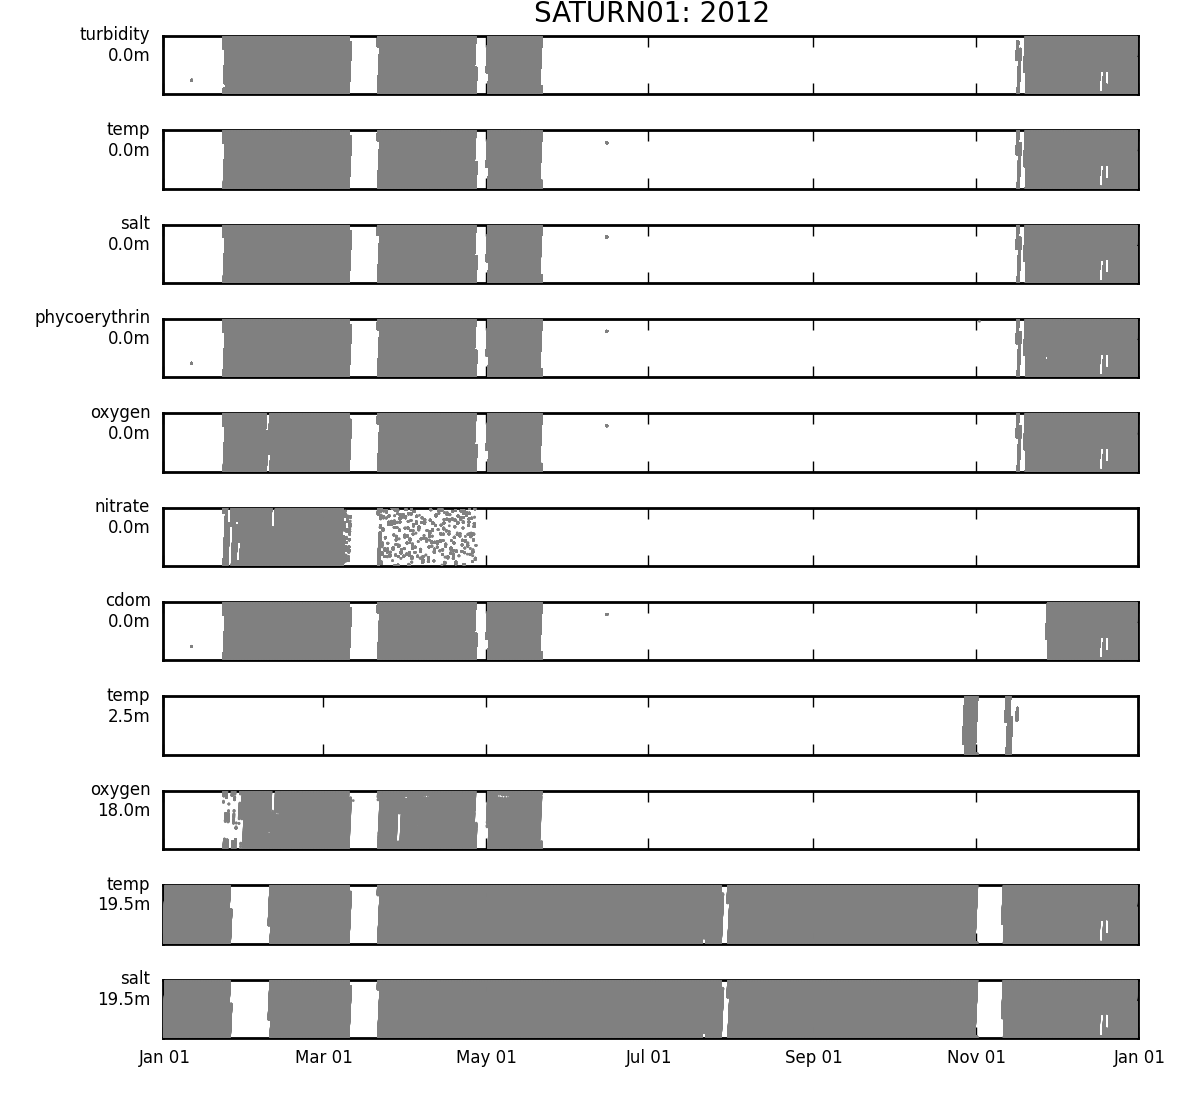
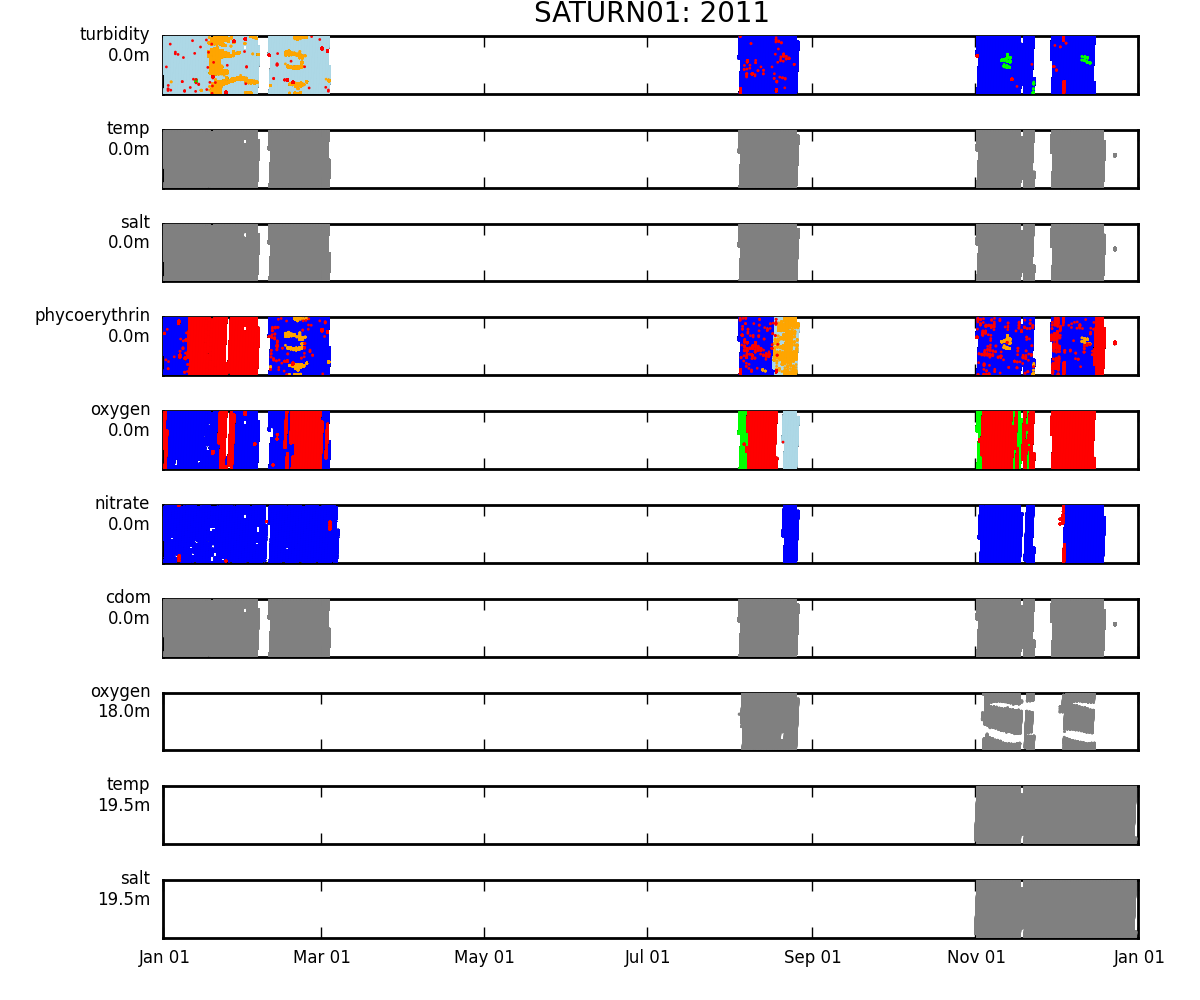
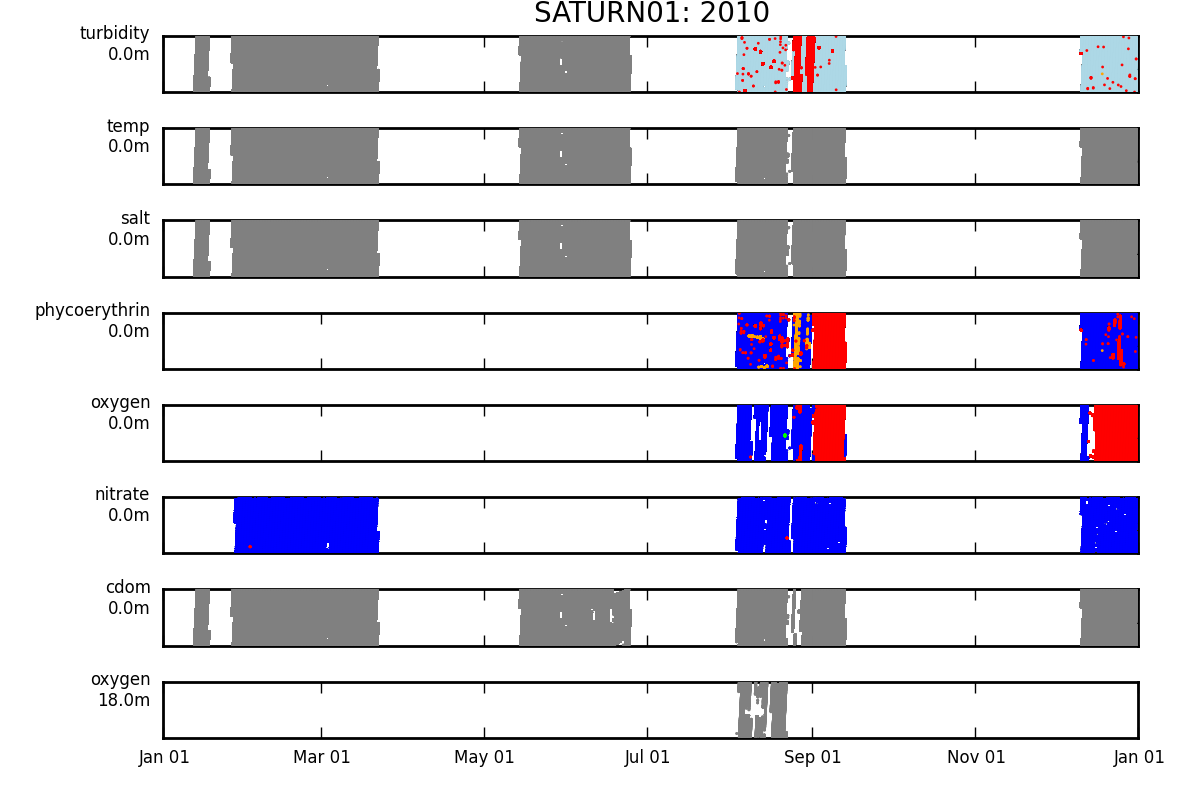
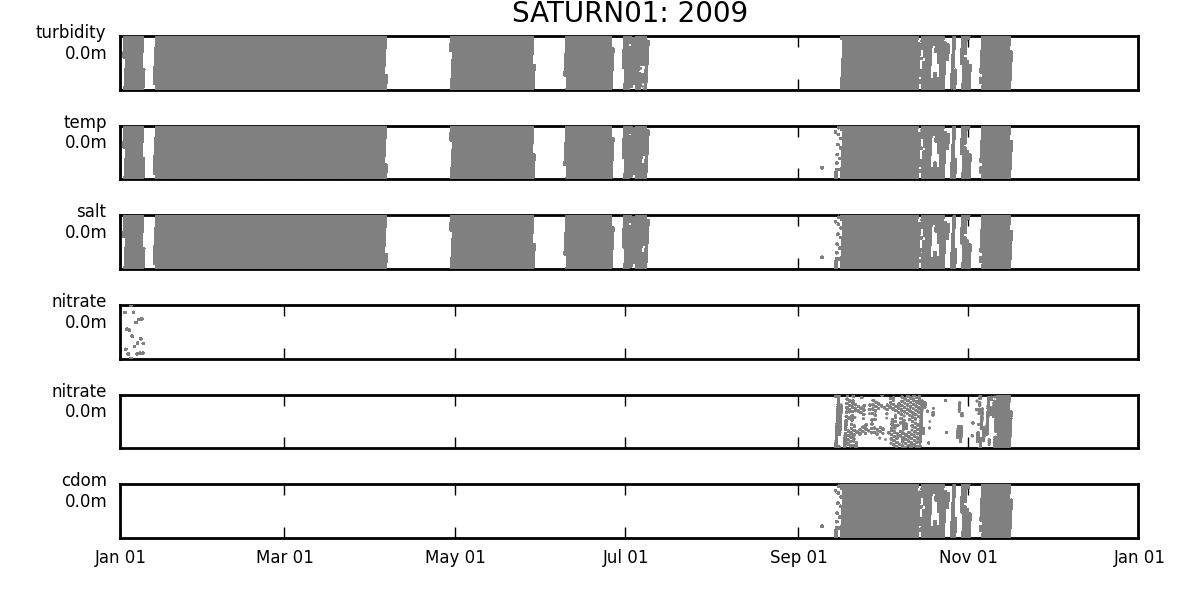
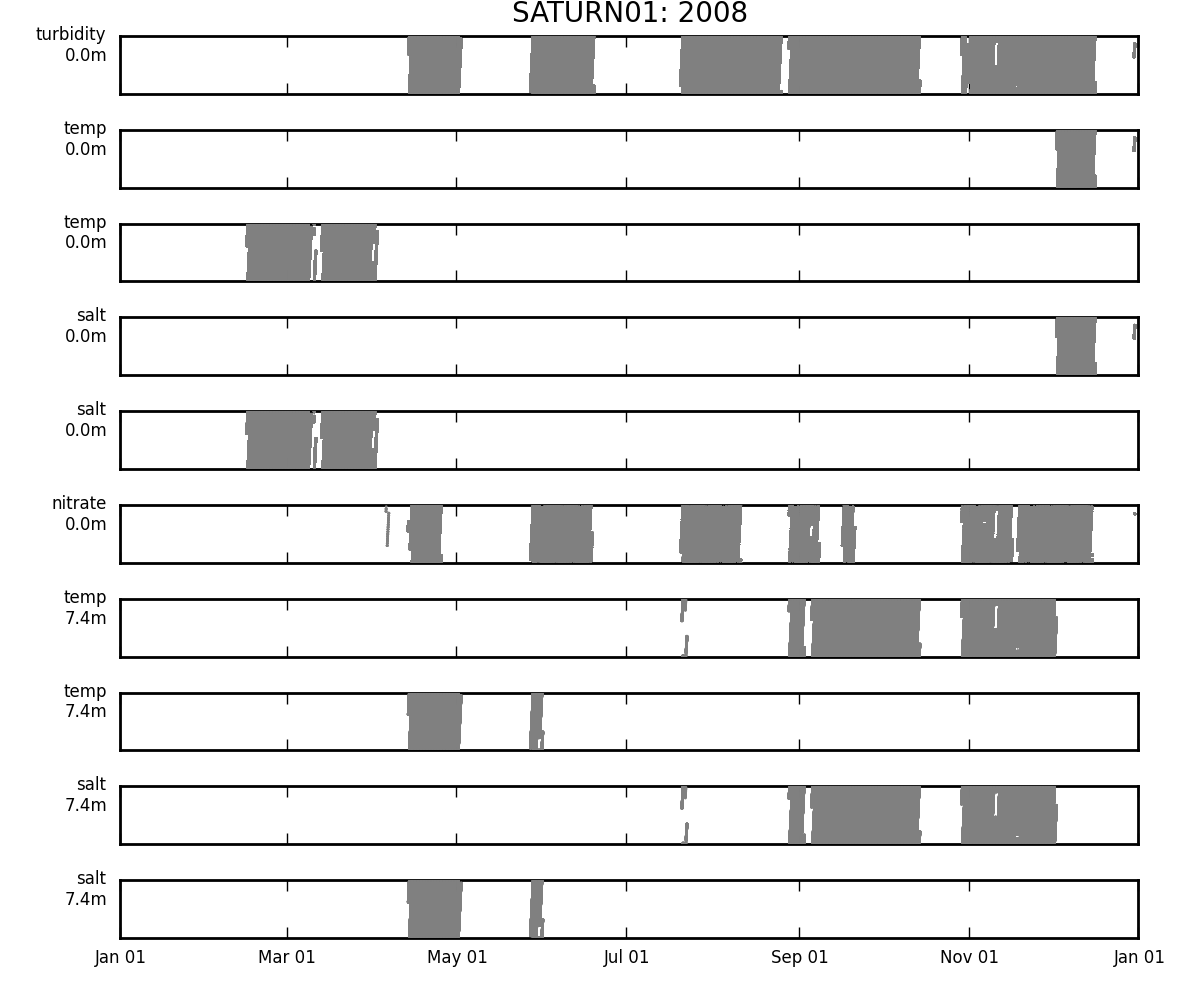
The graphs below plot the variable of interest using time of the observation against the fraction of the tidal
day
for that time colored by the quality levels for the given variable. Colors map to quality levels using the
following legend.

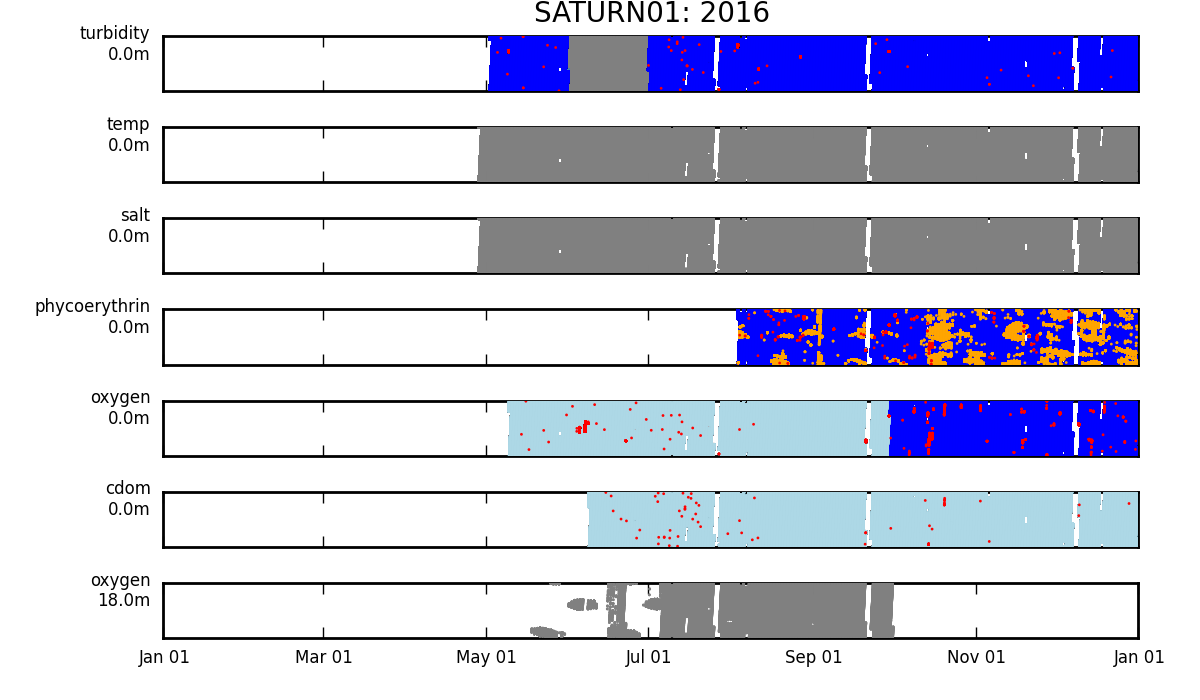
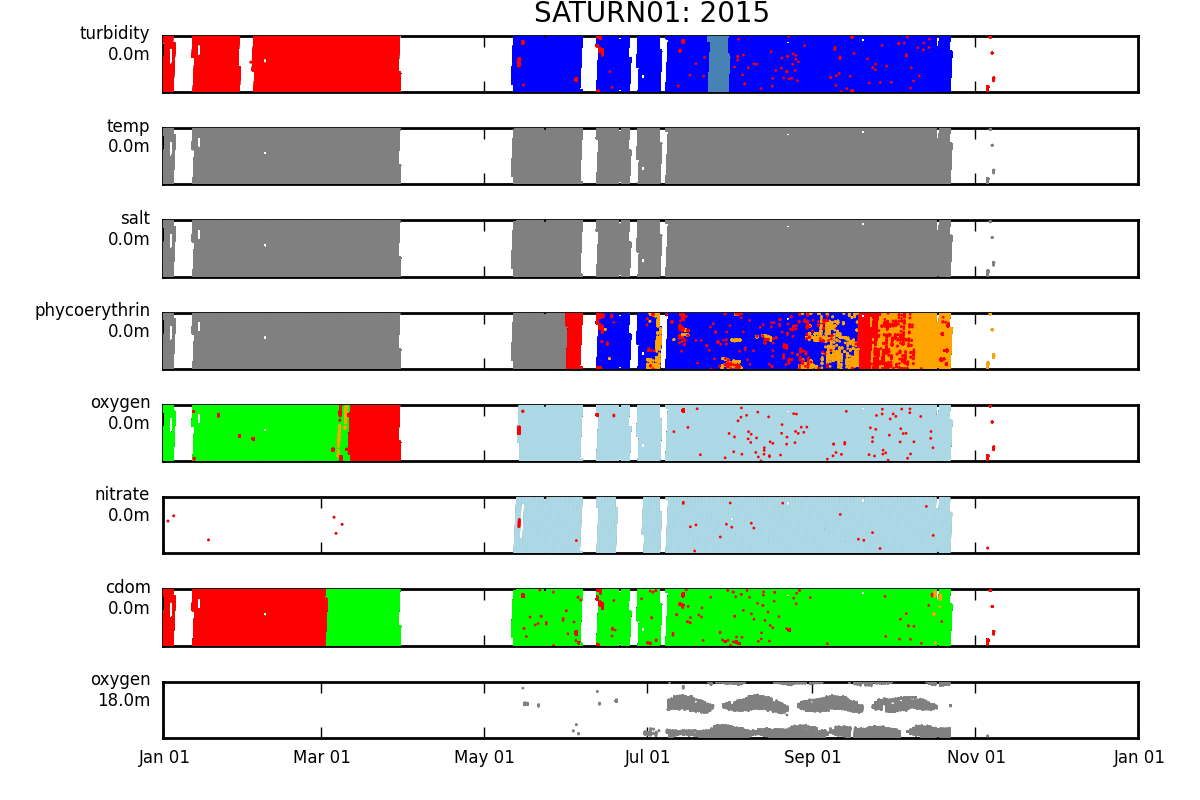
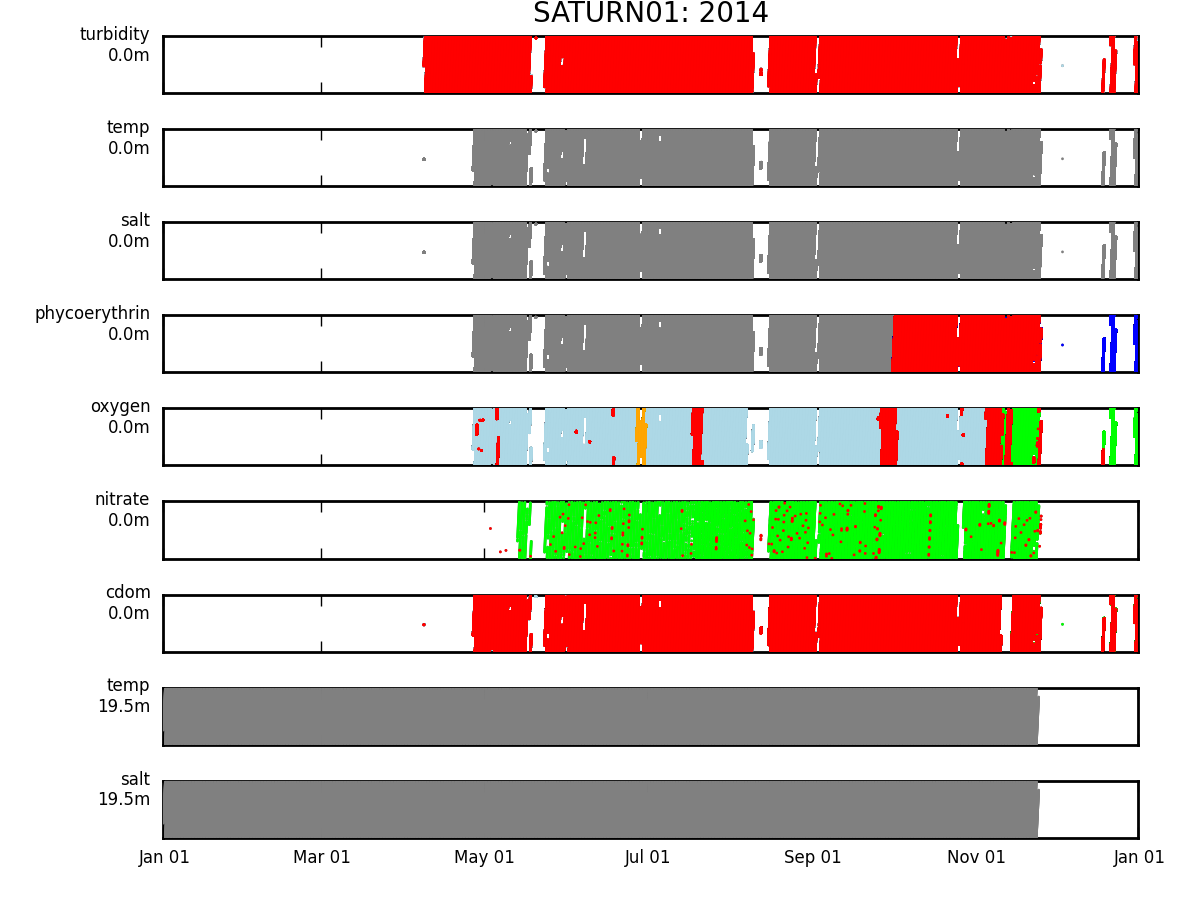
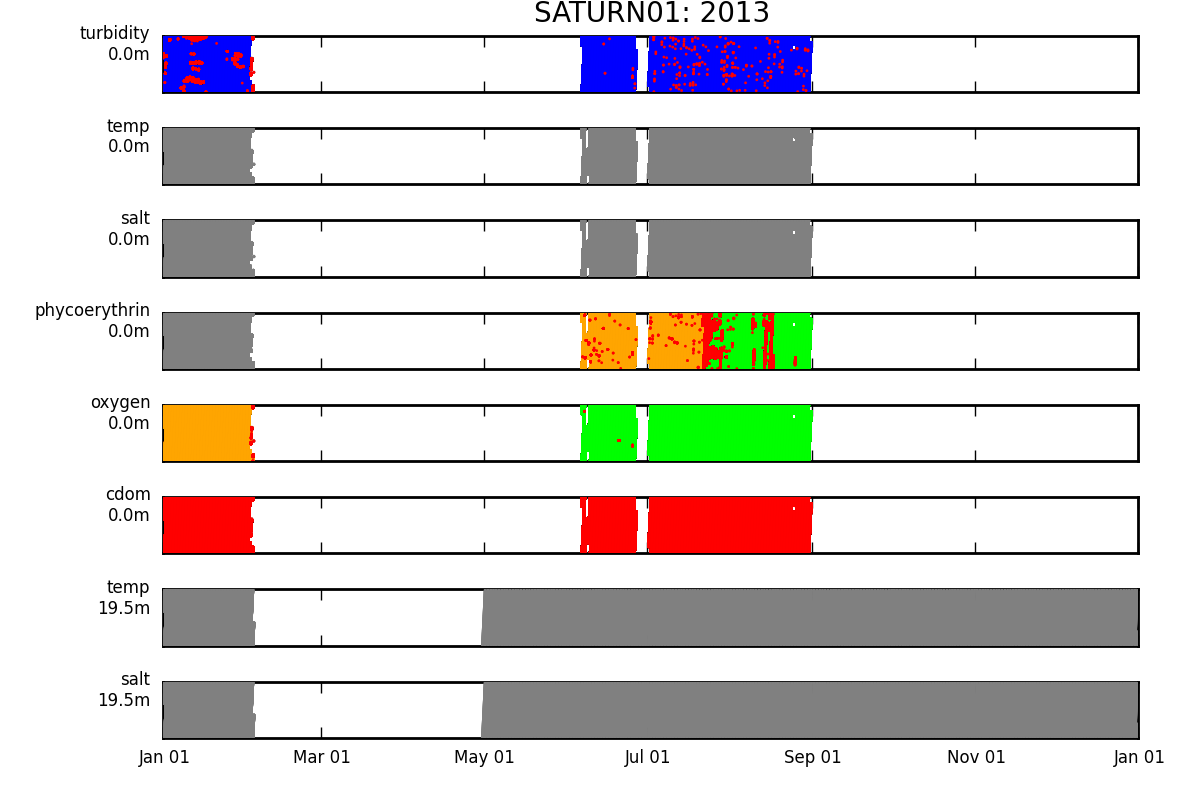

| Raw data | ||
| QL1: | is within current parameters for evaluating data as good (sensor specific) | |
| QL2: | is possibly within current parameters for evaluating data as good or is outside by a moderate degree | |
| QL3: | data quality issues/concerns or data corrected; see QA/QC information to determine if data are suitable | |
| QL4: | data have significant quality issues/concerns and should be used with caution | |
| QL5: | bad data; outliers |


