 This application enables users to generate and combine
different kinds of plots using multiple sites and variables (e.g. winds, waves, temperature) measured from the
past 60 days. It is a collaborative effort between CMOP and NANOOS,
adapting the CMOP Data Explorer tool to Pacific NW data distributed via the NANOOS Visualization System.
You have characters left
Session name
Share this session with others
- 1. Sources
- >> 2. Options
Available assets
Source:
Quality:
T. mod:
Variable:
X:
Y:
Colored by:
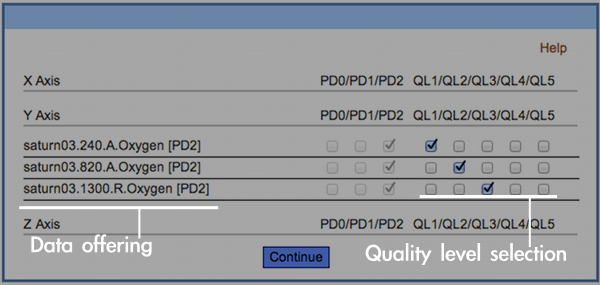
Select quality levels (Help)
Offering
Processing
Quality Levels
X Axis
PD0/PD1/PD2
QL1/QL2/QL3/QL4/QL5
Y Axis
PD0/PD1/PD2
QL1/QL2/QL3/QL4/QL5 Xpand
Colored by
PD0/PD1/PD2
QL1/QL2/QL3/QL4/QL5
For a description of Data Processing and Quality Levels click here
Check Xpand to use a different color for each PD2 quality level
For more information about data quality and processing levels click here
Current session:


