The Climatological Atlas is a scientific project, designed to offer insights into multiple scales of variability of the contemporary Columbia River coastal margin, via statistics of an extensive set of indicators. Access to products is through the Climatology Interface.
The focus of the Atlas is on indicators for the estuary and plume, but indicators of external forcing are also included for context. Due to their diversity, indicators have different data sources and levels of reliability. Data can come from observations, simulations, or analyses.
Estuary and plume indicators are typically virtual, in the sense that they are computed from approximately decade-long numerical simulations that integrate the Virtual Columbia River. Both the length and the skill of the simulation databases should be accounted for in evaluating how representative a virtual climatology or anomaly is.
General guidance for the use of indicators is available in the question and answer section of the climatology web site. However, we make no explicit or implied warranties of accuracy or suitability of any of the indicators, for any purpose other than a scientific study.
We hope you enjoy the Climatological Atlas. Please send comments or questions to cmop@critfc.org .
2.What is the meaning of a climatology based on only approximately a decade of “data”?
3. How to interpret virtual climatologies and anomalies in face of simulation error?
4. What simulation database is recommended for each indicator?
5. How often will the Atlas be updated?
How are virtual indicators computed?
(Date: February 13, 2013)
The computation of each indicator varies in methodology. Indicator-specific information is provided in the About page for that indicator. In general:
- Data on primary variables (salinity, temperature, water level, and velocity) is extracted from the appropriate simulation database(s ) of the Virtual Columbia River, in the form of time series at 15 minute intervals. Time series can be defined at a point, a vertical, a region, or a grid.
- Time series of primary variables are converted into a time series of indicators, using pre-defined definitions. At this stage, 15-minute data are either binned in days or, if required by the nature of the indicator (e.g., salinity intrusion length), processed to create time series of daily maxima or minima.
- Maps are currently restricted to salinity and its statistics. Maps are created from time series at each node of the computational horizontal grid. Maps include overall climatology and annual, quarterly and monthly climatologies and anomalies, each created by appropriate averaging and differencing. Quarterly and monthly maps can be defined per year or across years. Details are provided in the About page for maps.
- For most indicators, climatologies and anomalies are based on time series from a single point, or from combinations across a region that result in a region-representative value. For these indicators:
- Overview plots combines three time series and three statistics. The highest-frequency time series is at 15m intervals or (when the indicator has a single daily value, such as with the salinity intrusion length) at 24h intervals. The other time series are a 30-day running average and a series of annual averages. Statistics are computed across all years under consideration, and are the mean and the 25 and 75 percentiles.
- Climatology plots combine multiple daily statistics (mean, maxima, minima, and 25 and 75 percentiles of the daily means) computed across all years of record. Each statistic (except percentiles) refers to all values available in a given day of the year. For most indicators, this implies statistics on 96xN values, where N is the number of years of record. For selected indicators that have a single value per day (e.g., salinity intrusion length), statistics are based only on N values.
- Daily anomalies are computed as the daily average of the indicator for a given year minus the daily average for all years under consideration. The same principle applies to weekly, monthly, quarterly and annual anomalies. Hence, for example, monthly anomalies are computed as the monthly average of the indicator for a given year minus the monthly average for all years under consideration
What is the meaning of a climatology based on only approximately a decade of “data”?
(Date: January 1, 2010)
Climatologies and anomalies in the Atlas are only representative of the period for which they are computed. In the case of virtual indicators, the period is at most the length of the underlying simulation database, which is at most the number of years since 1999 (inclusive).
Having available only approximately a decade is clearly limiting, as illustrated in Figs. 1
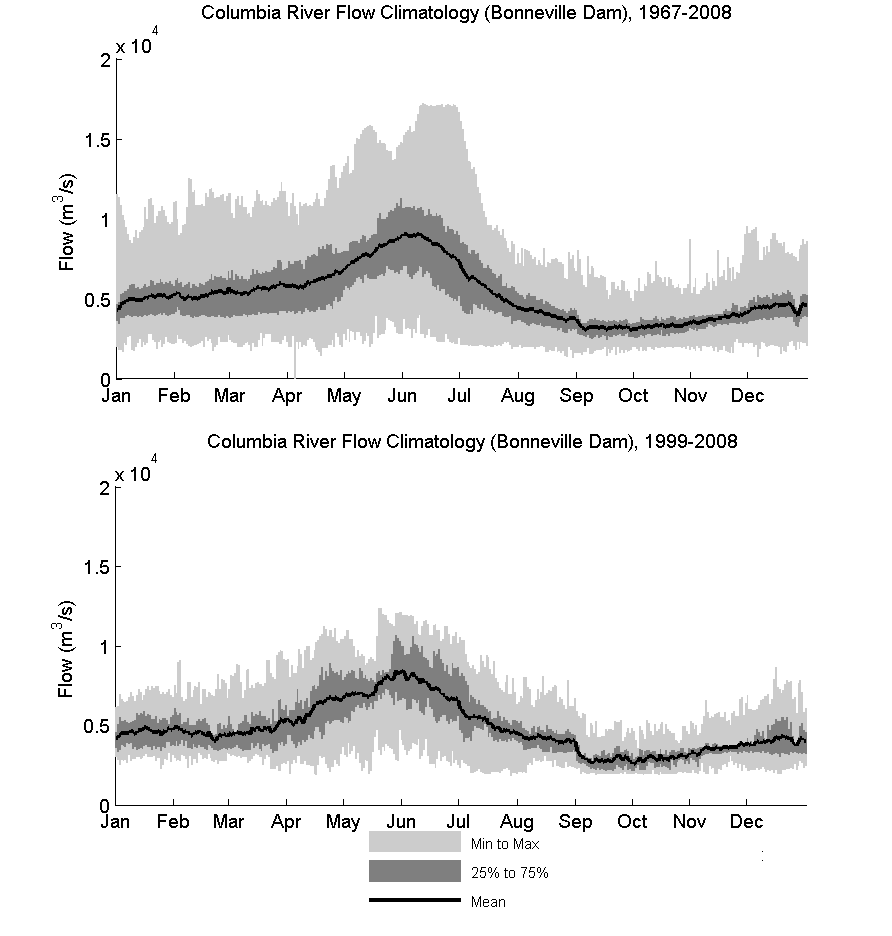
Figure 1: Columbia flow at Bonneville, 1967-2009 and 1999-2009.
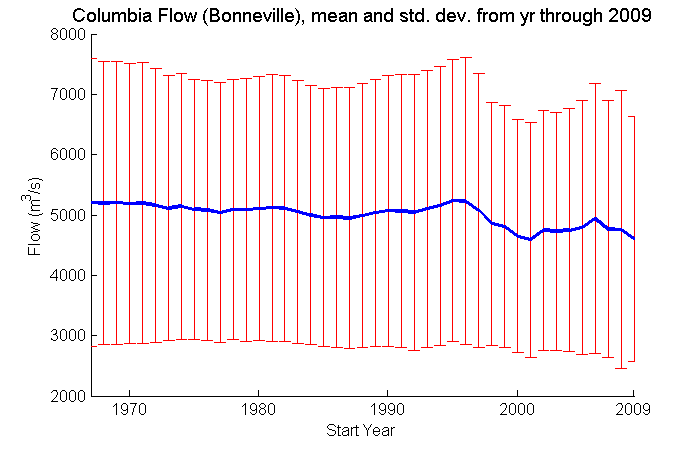
Figure 2: Mean and standard deviation of Columbia flow at Bonneville, decreasing number of years.

Figure 1: Columbia flow at Bonneville, 1967-2009 and 1999-2009.

Figure 2: Mean and standard deviation of Columbia flow at Bonneville, decreasing number of years.
Because ocean boundary conditions for the Virtual Columbia River are extracted from Navy simulations that start at 1999, there is no immediate opportunity to systematically extend the length of the simulation databases further into the past.
However, as time evolves, climatologies and anomalies based on the Virtual Columbia River simulation databases will become progressively more meaningful and better able to represent the contemporary variability of the system. Figs. 3
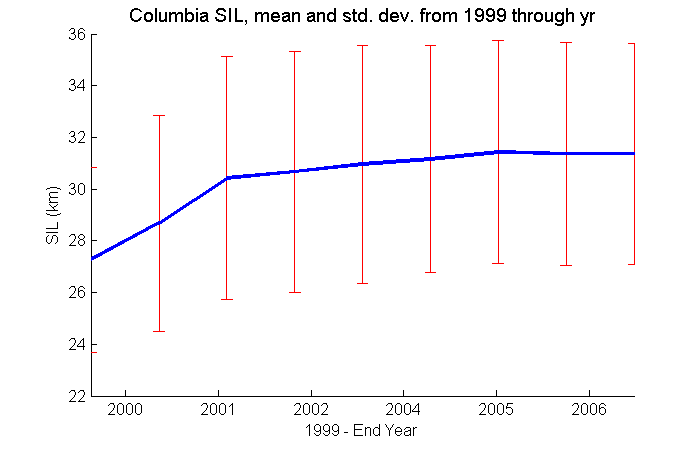
Figure 3: Mean and standard deviation for Salt Intrusion over increasing number of years.
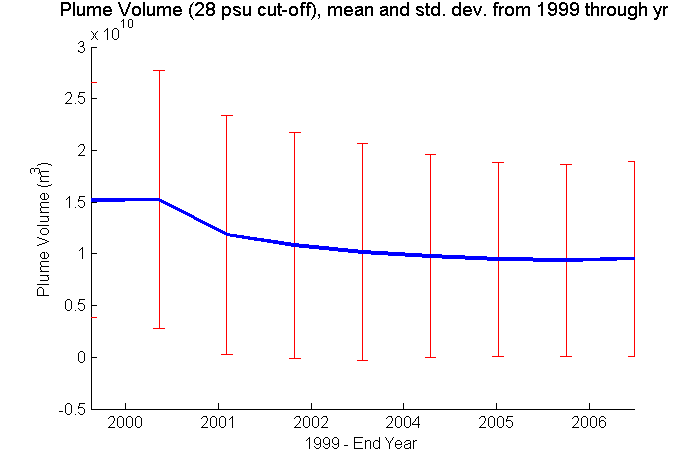
Figure 4: Mean and standard deviation for Plume Volume over increasing number of years.
[back to top]
How to interpret virtual climatologies and anomalies in face of simulation error?
(Date: January 1, 2010)
The confidence on any climatology or anomaly depends critically on the simulation skill for the variable(s) used in the definition of the indicator. This is one of the reasons why we continuously attempt to improve the simulation skill of the Virtual Columbia River.
However, many indicators are integrative and can not be observed directly. Even when the indicator matches exactly an observable variable (e.g., bottom salinity), it is rare that the location and/or time coverage of the available observations are ideal.
Hence the skill of the simulation-based indicators is most often indirectly inferred, at best (see About pages for indicator-specific discussion of the issue).
[back to top]
What simulation database is recommended for each indicator?
(Date: February 3, 2015)
Of the existing databases, DB31 is the preferred database for all metrics. Of pre-DB31 databasesm DB14 (which covers a river-to-shelf domain) is generally recommended for plume indicators, while DB22 (which focus on the estuary) is generally recommended for estuary indicators.
However,
- The About page for each indicator should be consulted for more specific guidance.
- Existing databases have particularly low or inconsistent skill in representing the temperature field, hence any temperature-based metric should be considered with extra caution.
- New simulation databases are occasionally added to the Virtual Columbia River, in an attempt to progressively improve the simulation skill. Hence, the recommendation on which database to use might change over time.
[back to top]
How often will the Atlas be updated?
(Date: February 3, 2015)
Our plan is to update the Atlas at least once a year, on or before February 1st. The typical update will consist in adding the prior year.
However, Atlas updates are tied to the available inventory of simulation databases. The goals and procedures for the maintenance of existing simulation databases were recently changed, and key databases (in particular DB14 and DB22) are no longer being updated past December 31, 2012 (DB14 may be updated selectively for the spring freshet for plume metrics).
Also, new databases are occasionally created to benefit from state-of-the-art simulation skill. A current example is DB33, which is anticipated to lead to an improved representation of salinity in many areas of the estuary. When a new database becomes available, the Atlas will add that database as an option as soon as logistically feasible, not waiting for the annual update.
[back to top]
Previous releases:
- release version 2016.1 for db33
- release version 2015.1 for db33
- release version 2014.1 for db33
Salt Intrusion
Salinity intrusion plays a major role in the circulation and ecology of the estuary. It is highly responsive to (and negatively correlated with) river discharge, and is enhanced by neap tides and by coastal upwelling.
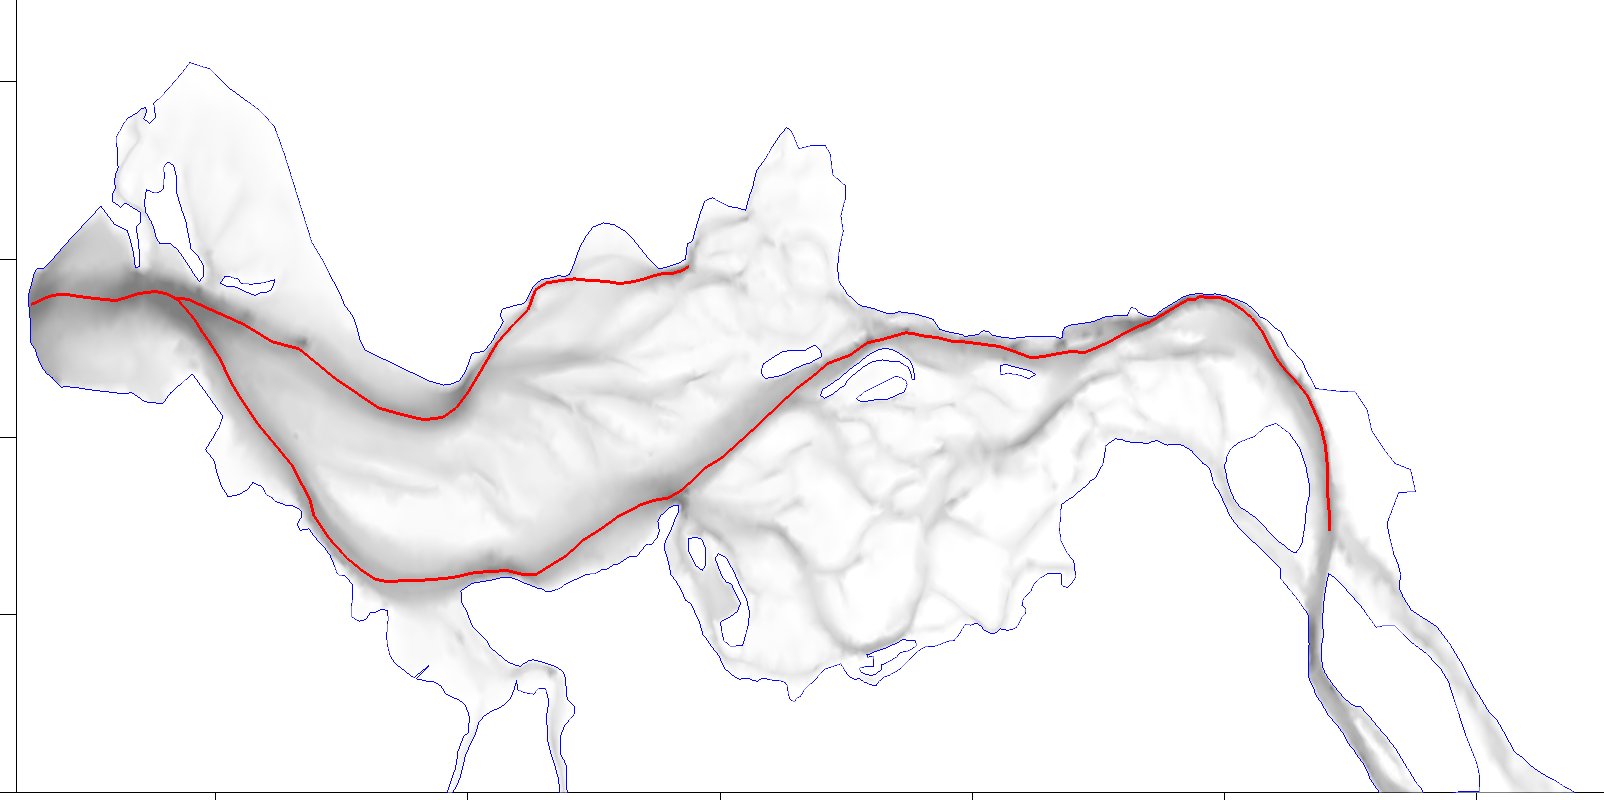
Measuring this indicator in the field is beyond the reach of the SATURN endurance stations, which lack spatial resolution. Direct field observation is in theory possible, and (for the South Channel) has been done on occasion, using a dedicated vessel. However, observations are labor-intensive and unfeasible with any kind of regularity.
Simulations that best represent this indicator are those that (a) perform best in a benchmark based on shipboard SIL observations in September 2007; and (b) best characterize the maximum salinity measured at witness SATURN stations (SATURN-01 in the North Channel, and AM169 and ELIOT in the South Channel.
Among the existing decade-long simulation databases (DB11, DB14, DB16, DB22, DB31), DB31 meets the above targets best. The previous best database, DB22, was previously highlighted in the climatological atlas, and remains available. However, it is not being updated beyond 2011. Certain features of ELIOT data are not fully captured by DB31, suggesting that there is significant room for improvement in the climatological characterization of this indicator.
Plume Metrics
The Columbia River plume exerts a major influence on the ocean environment off the Pacific Northwest (PNW) coast. Plume dynamcis are influenced primarily by river flow, wind and tidal amplitude.
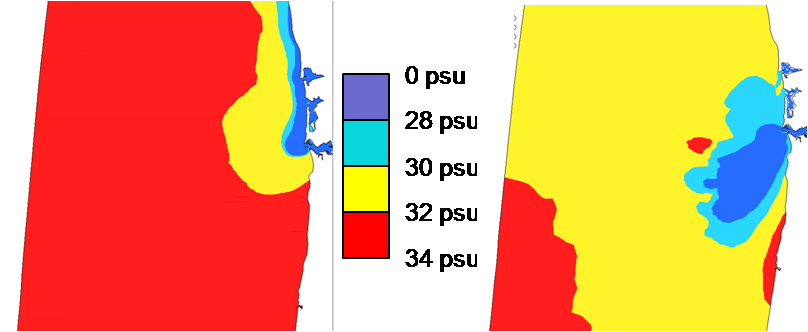
River water experiences significant mixing before and after leaving the estuary, making a single all-purpose definition of the plume difficult or impossible. An initial 28 psu cut-off to define has been applied for all plume metrics. All water outside the Columbia River mouth below 28 psu is considered plume water. Previous plume calculations were based on SELFE model database 14. Plume calculations are now available from 1999-2014 based on SELFE model database 31.
Plume climatologies are composed of the maximum and minimum values for all days (e.g. min/max of Jan 1 values from 1999 through 2010), the mean daily values and the 25th and 75th percentiles of the mean daily values. Histograms are based on daily mean values and anomalies are based on mean values for the given interval (daily, weekly, monthly, seasonally or yearly).
Plume Metrics include:- Plume Area: The surface area of the water below the cut-off salinity.
- Plume Depth: The mean depth of the water below the cut-off salinity.
- Plume Volume: The volume of the water below the cut-off salinity.
- Plume Centroid, N-S location: The mean North-South location, in Oregon State Plane North (NAD27) coordinates, of water below the cut-off salinity.
- Plume Centroid, E-W location: The mean East-West location, in Oregon State Plane North (NAD27) coordinates, of water below the cut-off salinity.
Plume Metrics
The Columbia River plume exerts a major influence on the ocean environment off the Pacific Northwest (PNW) coast. Plume dynamcis are influenced primarily by river flow, wind and tidal amplitude.

River water experiences significant mixing before and after leaving the estuary, making a single all-purpose definition of the plume difficult or impossible. An initial 28 psu cut-off to define has been applied for all plume metrics. All water outside the Columbia River mouth below 28 psu is considered plume water. Previous plume calculations were based on SELFE model database 14. Plume calculations are now available from 1999-2014 based on SELFE model database 31.
Plume climatologies are composed of the maximum and minimum values for all days (e.g. min/max of Jan 1 values from 1999 through 2010), the mean daily values and the 25th and 75th percentiles of the mean daily values. Histograms are based on daily mean values and anomalies are based on mean values for the given interval (daily, weekly, monthly, seasonally or yearly).
Plume Metrics include:- Plume Area: The surface area of the water below the cut-off salinity.
- Plume Depth: The mean depth of the water below the cut-off salinity.
- Plume Volume: The volume of the water below the cut-off salinity.
- Plume Centroid, N-S location: The mean North-South location, in Oregon State Plane North (NAD27) coordinates, of water below the cut-off salinity.
- Plume Centroid, E-W location: The mean East-West location, in Oregon State Plane North (NAD27) coordinates, of water below the cut-off salinity.
Plume Metrics
The Columbia River plume exerts a major influence on the ocean environment off the Pacific Northwest (PNW) coast. Plume dynamcis are influenced primarily by river flow, wind and tidal amplitude.

River water experiences significant mixing before and after leaving the estuary, making a single all-purpose definition of the plume difficult or impossible. An initial 28 psu cut-off to define has been applied for all plume metrics. All water outside the Columbia River mouth below 28 psu is considered plume water. Previous plume calculations were based on SELFE model database 14. Plume calculations are now available from 1999-2014 based on SELFE model database 31.
Plume climatologies are composed of the maximum and minimum values for all days (e.g. min/max of Jan 1 values from 1999 through 2010), the mean daily values and the 25th and 75th percentiles of the mean daily values. Histograms are based on daily mean values and anomalies are based on mean values for the given interval (daily, weekly, monthly, seasonally or yearly).
Plume Metrics include:- Plume Area: The surface area of the water below the cut-off salinity.
- Plume Depth: The mean depth of the water below the cut-off salinity.
- Plume Volume: The volume of the water below the cut-off salinity.
- Plume Centroid, N-S location: The mean North-South location, in Oregon State Plane North (NAD27) coordinates, of water below the cut-off salinity.
- Plume Centroid, E-W location: The mean East-West location, in Oregon State Plane North (NAD27) coordinates, of water below the cut-off salinity.
Plume Metrics
The Columbia River plume exerts a major influence on the ocean environment off the Pacific Northwest (PNW) coast. Plume dynamcis are influenced primarily by river flow, wind and tidal amplitude.

River water experiences significant mixing before and after leaving the estuary, making a single all-purpose definition of the plume difficult or impossible. An initial 28 psu cut-off to define has been applied for all plume metrics. All water outside the Columbia River mouth below 28 psu is considered plume water. Previous plume calculations were based on SELFE model database 14. Plume calculations are now available from 1999-2014 based on SELFE model database 31.
Plume climatologies are composed of the maximum and minimum values for all days (e.g. min/max of Jan 1 values from 1999 through 2010), the mean daily values and the 25th and 75th percentiles of the mean daily values. Histograms are based on daily mean values and anomalies are based on mean values for the given interval (daily, weekly, monthly, seasonally or yearly).
Plume Metrics include:- Plume Area: The surface area of the water below the cut-off salinity.
- Plume Depth: The mean depth of the water below the cut-off salinity.
- Plume Volume: The volume of the water below the cut-off salinity.
- Plume Centroid, N-S location: The mean North-South location, in Oregon State Plane North (NAD27) coordinates, of water below the cut-off salinity.
- Plume Centroid, E-W location: The mean East-West location, in Oregon State Plane North (NAD27) coordinates, of water below the cut-off salinity.
Plume Metrics
The Columbia River plume exerts a major influence on the ocean environment off the Pacific Northwest (PNW) coast. Plume dynamcis are influenced primarily by river flow, wind and tidal amplitude.

River water experiences significant mixing before and after leaving the estuary, making a single all-purpose definition of the plume difficult or impossible. An initial 28 psu cut-off to define has been applied for all plume metrics. All water outside the Columbia River mouth below 28 psu is considered plume water. Previous plume calculations were based on SELFE model database 14. Plume calculations are now available from 1999-2014 based on SELFE model database 31.
Plume climatologies are composed of the maximum and minimum values for all days (e.g. min/max of Jan 1 values from 1999 through 2010), the mean daily values and the 25th and 75th percentiles of the mean daily values. Histograms are based on daily mean values and anomalies are based on mean values for the given interval (daily, weekly, monthly, seasonally or yearly).
Plume Metrics include:- Plume Area: The surface area of the water below the cut-off salinity.
- Plume Depth: The mean depth of the water below the cut-off salinity.
- Plume Volume: The volume of the water below the cut-off salinity.
- Plume Centroid, N-S location: The mean North-South location, in Oregon State Plane North (NAD27) coordinates, of water below the cut-off salinity.
- Plume Centroid, E-W location: The mean East-West location, in Oregon State Plane North (NAD27) coordinates, of water below the cut-off salinity.
Columbia River Flow at Bonneville
The Columbia River flow measured at the Bonneville Dam occurs beyond the tidal signal. It is measured by the US Army Corps of Engineers.
Columbia River flow climatologies are currently based on measurements covering the period of model hindcasts: 1999 through 2014. Climatologies are composed of the maximum and minimum values for all days (e.g. min/max of Jan 1 values from 1999 through 2014), the mean daily values and the 25th and 75th percentiles of the mean daily values. Histograms are based on daily mean values and anomalies are based on mean values for the given interval (daily, weekly, monthly, seasonally or yearly).
Columbia River Temperature at Bonneville Dam/Warrendale
The Columbia River Temperature is measured by the US Army Corps of Engineers at Bonneville Dam and Warrendale (6 miles downstream of Bonneville).
Both the Warrendale and Bonneville Dam temperature records since 2004 have extended data gaps, but combined they provide a nearly continous record. During (extensive) periods of overlap, the two datasets show very good agreement. The Columbia River Temperature climatology is therefore constructed from the combination of these two datasets (with preference given to Bonneville Dam data when it is available). Columbia River Temperature climatologies are currently based on measurements covering the period of model hindcasts: 1999 through 2014. Climatologies are composed of the maximum and minimum values for all days (e.g. min/max of Jan 1 values from 1999 through 2014), the mean daily values and the 25th and 75th percentiles of the mean daily values. Histograms are based on daily mean values and anomalies are based on mean values for the given interval (daily, weekly, monthly, seasonally or yearly).
Columbia River Residence Time

Residence time climatology is calculuted on a daily basis. Climatology min/max are the daily min/max, not the min/max of the daily average. Percentiles are based on daily mean values. Climatology histograms are based on daily mean values. Anomalies are based on mean values (daily, weekly, monthly, seasonally and yearly).
Columbia River Flow at Beaver Army
The Columbia River flow measured at the USGS Beaver Army station 14246900 is well within the range of tidal influence. Data was recieved by CMOP via email. Beaver Army flow climatologies are based on measurements covering the period of model hindcasts: 1999 through 2014. The data contains significant gaps, visible on the overview and yearly data overlay images.
Climatologies are composed of the maximum and minimum values for all days (e.g. min/max of Jan 1 values from 1999 through 2014), the mean daily values and the 25th and 75th percentiles of the mean daily values. Histograms are based on daily mean values and anomalies are based on mean values for the given interval (daily, weekly, monthly, seasonally or yearly).
Pacific Decadal Oscillation
The Pacific Decadal Oscillation (PDO) Index is defined as the leading principal component of North Pacific monthly sea surface temperature variability (poleward of 20N for the 1900-93 period).
As the quote suggests, data is computed on a monthly basis. Thus, all climatologies are calculated at monthly, rather than daily, intervals. As of Feb 2014 JISAO's web site contained good information on PDO and the PDO Index, as well as a link to the raw data.
Even though only the periods covered by CMOP hindcast databases (1999-2014) are plotted, climatology is based on the full range of available data (1900-2014).
Coastal Upwelling Index
Coastal upwelling index(CUI) climatolgies are based on daily CUI values generated by NOAA Fisheries Southwest Fisheries Science Center's Environmental Research Division (ERD). Climatologies are based on the full range of available CUI data (1967-2012)
The data is downloaded from the ERD Live Access Server.
Descriptions of the CUI can be found at the following two links. Portions of the text from those sites are included here.
From http://www.pfel.noaa.gov/products/PFEL/modeled/indices/upwelling/NA/what_is_upwell.html:
What is an Upwelling Index?
The frictional stress of equatorward wind on the ocean's surface, in concert with the effect of the earth's rotation, causes water in the surface layer to move away from the western coast of continental land masses. This offshore moving water is replaced by water which upwells, or flows toward the surface from depths of 50 to 100 meters and more. Upwelled water is cooler and saltier than the original surface water, and typically has much greater concentrations of nutrients such as nitrates, phosphates and silicates that are key to sustaining biological production. It is for this reason that marine ecosystems in the ocean's eastern boundary currents are highly productive, and capable of maintaining large standing crops of plankton, massive fish stocks such as sardines and anchovies, and major populations of marine mammals and sea birds. The major eastern boundary currents include the Canary off the Iberian peninsula and northwestern Africa, the Benguela off southwestern Africa, the Peru off western South America, and the California Current System off western North America. Moreover variations in upwelling over seasonal to interannual periods, due to large-scale shifts in wind patterns and atmospheric systems, are linked to variability in fish populations and other biological components in coastal ocean ecosystems.
From http://www.pfel.noaa.gov/products/PFEL/modeled/indices/upwelling/NA/how_computed.html
How ERD Determines the Upwelling Indices
ERD coastal upwelling indices are calculated based upon Ekman's theory of mass transport due to wind stress. Assuming homogeneity, uniform wind and steady state conditions, the mass transport of the surface water due to wind stress is 90° to the right of the wind direction in the Northern Hemisphere. Ekman mass transport is defined as the wind stress divided by the Coriolis parameter (a function of the earth's rotation and latitude). The depth to which an appreciable amount of this offshore transport occurs is termed the surface Ekman layer, and is generally 50 to 100 meters deep.
Ekman transports are resolved into components parallel and normal to the local coastline orientation. The magnitude of the offshore component is considered to be an index of the amount of water upwelled from the base of the Ekman layer. Positive values are, in general, the result of equatorward wind stress. Negative values imply downwelling, the onshore advection of surface waters accompanied by a downward displacement of water.
Historically, the indices were computed from monthly mean pressure fields prepared by FNMOC on a 3° mesh grid. After providing ERD with several alternate pressure field grids over time, FNMOC currently produces six-hourly fields of surface pressure on a global spherical 1° mesh (a 180 x 360 grid). The standard west coast six-hourly upwelling indices are a product of the 3° pressure field interpolated from the 1° grid. Monthly indices are derived from a 3° mesh that is interpolated from the monthly-averages of the six-hourly 1° pressures.
CUI climatology is calculuted on a daily basis. Because CUI has one value for the entire day there is no ambiguity between true min/max and min/max of the daily average. Anomalies are based on mean values (daily, weekly, monthly, seasonally and yearly).
Multivariate El Nino/Southern Oscillation Index
The Multivariate El Nino/Southern Oscillation Index (MEI) is calculated by Klaus Wolter at NOAA. As of Mar 2012 the data and a description of the index can be found at: http://www.esrl.noaa.gov/psd/enso/mei/
Part of the description from Klaus Wolter's web site:
El Nino/Southern Oscillation (ENSO) is the most important coupled ocean-atmosphere phenomenon to cause global climate variability on interannual time scales. Here we attempt to monitor ENSO by basing the Multivariate ENSO Index (MEI) on the six main observed variables over the tropical Pacific. These six variables are: sea-level pressure (P), zonal (U) and meridional (V) components of the surface wind, sea surface temperature (S), surface air temperature (A), and total cloudiness fraction of the sky (C). These observations have been collected and published in COADS for many years. The MEI is computed separately for each of twelve sliding bi-monthly seasons (Dec/Jan, Jan/Feb,..., Nov/Dec). After spatially filtering the individual fields into clusters (Wolter, 1987), the MEI is calculated as the first unrotated Principal Component (PC) of all six observed fields combined...
Because MEI is calculated on a monthly basis, all climatologies are calculated at monthly, rather than daily, intervals. Even though only the periods covered by CMOP hindcast databases (1999-2012) are plotted, climatology is based on the full range of available data (1950-2012).
