I’ve taken a look at the data from the phycoerythrin sensor at Saturn03 as well as the data from the clean water measurements that have been made almost daily over the summer thanks to the field team.
The PE sensor at Saturn03 is much noisier since it was re-deployed in July. The following figure shows plots of phycoerythrin vs. turbidity by month for the 2010 & 2011 summer side by side. Note that the scales are different due to shifts in both the turbidity & phycoerythrin baselines after the July re-deployment of these sensors, but the axes have identical ranges (50,000 rfu’s for PE & 160 ntu’s for turbidity) so that they may be easily compared.
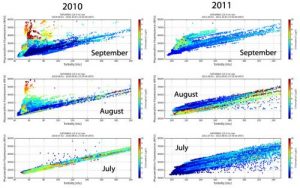
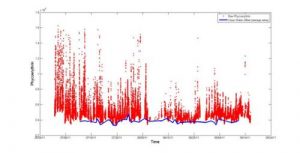
The noise is due in large part to a drifting/wandering of the phycoerythrin baseline. It appears that the wandering occurs from relatively rapid shifts (over the course of hours or less) in the PE baseline, followed by intervening periods of baseline stability.

The important point is that this sensor did not behave this way during its earlier deployment so we should try to determine what has caused this change and whether or not it is not a properly functioning sensor.
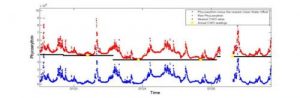
I also took a look at whether the clean water offset data could be used to capture and correct for the baseline wandering. When looking at a plot of all of the data, it does look like the CWO data track the baseline fairly well and are a good indicator of the instument’s stability.
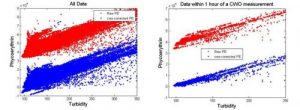
“As an event detection tool, I think making a slope-based correction for turbidity and then subtracting the lowest corrected PE signal from all three PE signals would work reasonably well (looking back at 2010 data, this method looks like it would have underestimated the magnitude of the PE events at some points where a PE signal was present at all three depths, but would have identified high concentration events. There would remain a large uncertainty in the magnitude of the events (due to the possibility that the lowest value is not a non-detect), but it might at least accurately flag non-events as non-events and events as events. It would also discard all data for which there is not at least 2 depths available.”
I will look into using the data in this way.